
Requirement
Let’s say we want to show aggregated total of the records based on the grouping. let’s understand this with below example:
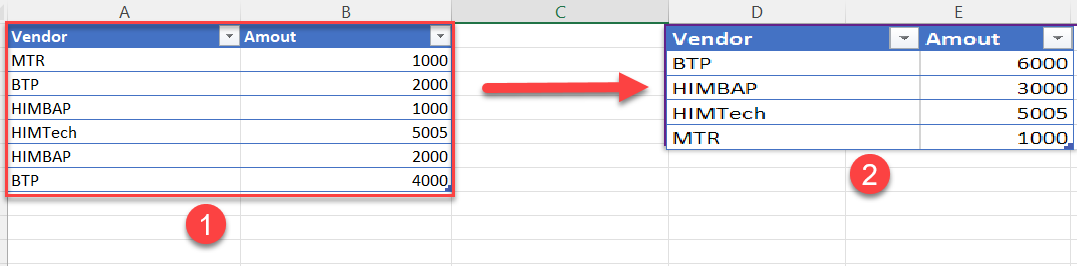
In above screenshot group 1 as what we have in our entity and 2 is what we want to show on the dashboard, just want to show single entry for the duplicate record and calculate total.
Details:
I am going to use data table here to show this data on dashboard. We need to create HTML web resource
using any html editor. First we need to add reference for the cdn and script in our web resource.
<script src="ClientGlobalContext.js.aspx" type="text/javascript"></script>
    <link rel="stylesheet" href="https://cdn.datatables.net/1.10.16/css/jquery.dataTables.min.css">
    <link rel="stylesheet" href="https://cdn.datatables.net/select/1.2.5/css/select.dataTables.min.css">
    <link rel="stylesheet" href="https://maxcdn.bootstrapcdn.com/bootstrap/3.3.7/css/bootstrap.min.css">
    <script src="https://code.jquery.com/jquery-1.12.4.js"></script>
    <script src="https://cdn.datatables.net/1.10.16/js/jquery.dataTables.min.js"></script>
Next we need to fetch data from CRM based on our query
function LoadVendorGrid() {
            debugger;
            var query = "?$apply=groupby((new_name),aggregate(new_amount with sum as total))&$filter=new_amount gt 0 and new_name ne null";
            window.parent.Xrm.WebApi.retrieveMultipleRecords("new_vendor", query).then(
                function success(results) {
                    var result = results.entities;
                    if (result != null) {
                        $('#vendordt').DataTable({
                            "bInfo": false,
                            data: result,
                            columns: [
                                { data: 'new_name' },
                                { data: 'total', render: $.fn.dataTable.render.number(',', '.', 0, '₹') }
                            ]
                        });
                    }

                },
                function (error) {
                    console.log(error.message);

                }
            )
        }
In above code I am fetching details from the vendor entity and grouping data based on the name as well as checking condition to render records where amount is >0 and name is not null to avoid and error in data table rendering. Once we got result we can pass our fields to the data table column like above. Finally we need to make call to this method. Here is the full code of the html web resource.
<html>
<head>
    <script src="https://ajax.googleapis.com/ajax/libs/jquery/3.5.1/jquery.min.js"></script>
    <link rel="stylesheet" type="text/css" href="https://cdn.datatables.net/1.11.3/css/jquery.dataTables.min.css">
    <script type="text/javascript" charset="utf8" src="https://cdn.datatables.net/1.11.3/js/jquery.dataTables.min.js"></script>
    <script src="ClientGlobalContext.js.aspx" type="text/javascript"></script>
    <meta charset="utf-8">
    <title></title>
    <script type="text/javascript">
        $(document).ready(function () {
            LoadVendorGrid();
        });
        function LoadVendorGrid() {
            debugger;
            var query = "?$apply=groupby((new_name),aggregate(new_amount with sum as total))&$filter=new_amount gt 0 and new_name ne null";
            window.parent.Xrm.WebApi.retrieveMultipleRecords("new_vendor", query).then(
                function success(results) {
                    var result = results.entities;
                    if (result != null) {
                        $('#vendordt').DataTable({
                            "bInfo": false,
                            data: result,
                            columns: [
                                { data: 'new_name' },
                                { data: 'total', render: $.fn.dataTable.render.number(',', '.', 0, '₹') }
                            ]
                        });
                    }

                },
                function (error) {
                    console.log(error.message);

                }
            )
        }
    </script>
   </head>
<body onfocusout="parent.setEmailRange();" style="overflow-wrap: break-word;">

<table id="vendordt" class="cell-border">

<thead>

<tr>

<th>Vendor Name</th>


<th>Amout</th>

            </tr>

        </thead>

    </table>

</body>
</html>
Now we can place this code in html web resource and place it to the dashboard. While rendering it should look like below:
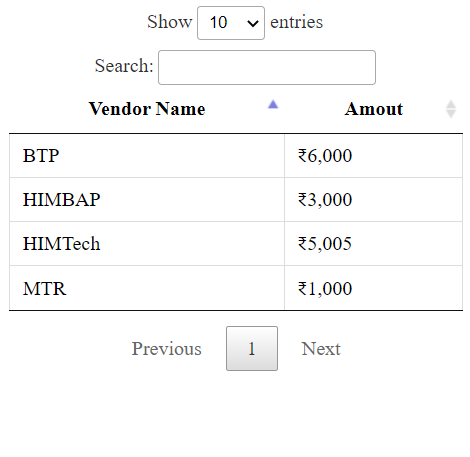
This is how we can use data table and use it’s out of the box search, sorting and paging features.
Hope it will help someone !!
Keep learning and Keep Sharing !!